An in-depth analysis of Frontier Airlines' operational and financial performance, focusing on its low-cost model, passenger growth, flight frequency, ASM, RPM, load factor, and detailed revenue and net income insights, offering a clear view of the airline’s performance and stability.
1. Total Passengers Carried
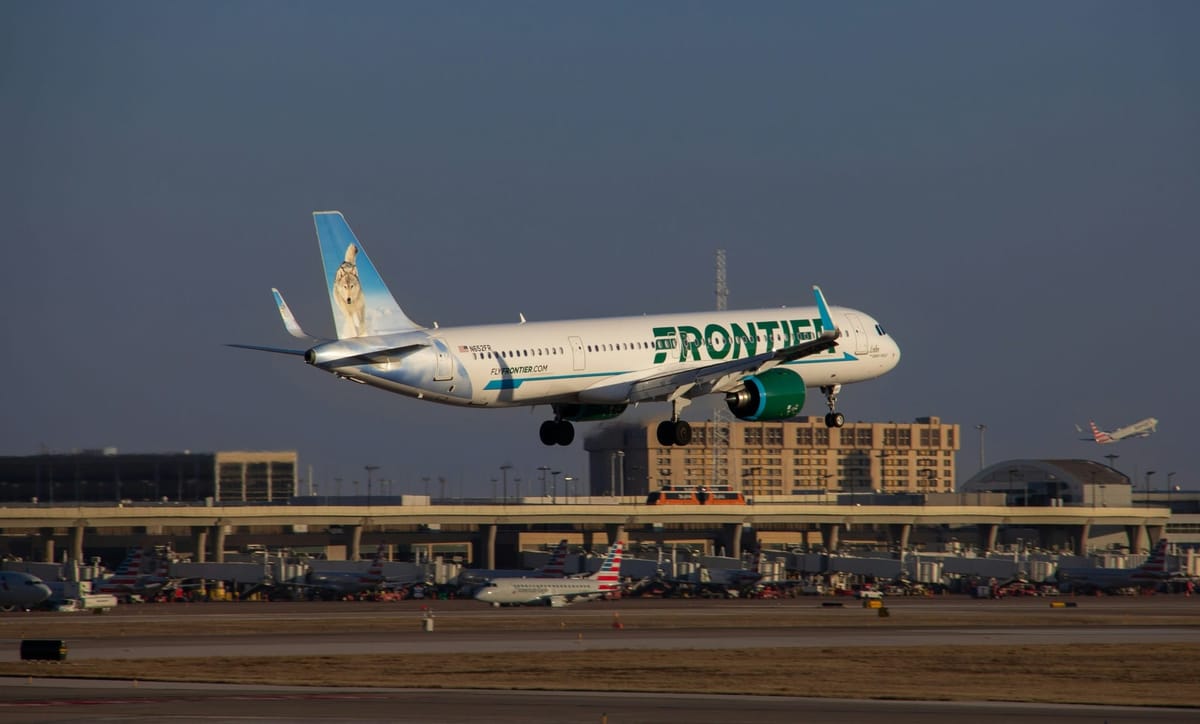
In 2023, Frontier Airlines transported approximately ∼30.2 million passengers, marking a ∼19% increase from the previous year. This growth aligns with a 20% year-over-year rise in revenue passenger miles (RPMs), reaching 30.8 billion, indicating enhanced network efficiency and demand stimulation. The airline's strategic focus on underserved markets and secondary airports has been instrumental in capturing new customer segments and driving passenger volume growth.
The airline's fleet modernization strategy has significantly contributed to its capacity to transport more passengers. By operating the youngest A320neo family fleet in the U.S., Frontier has improved fuel efficiency and reduced operating costs. These savings have been passed on to passengers through lower fares, stimulating demand and increasing load factors. The airline's high-density seating configuration further maximizes available seat miles (ASMs), enabling it to transport more passengers per flight.
Frontier's commitment to environmental sustainability has also influenced passenger preferences. In 2024, the airline was recognized as the “North American Environmental Sustainability Airline of the Year” by the Centre for Aviation, highlighting its industry-leading emissions reductions and efficiency. This recognition resonates with environmentally conscious travelers, potentially influencing their choice of airline and contributing to increased passenger numbers.
Operational reliability is another factor contributing to passenger growth. In December 2023, Frontier achieved a record-setting 99.38% flight completion rate, the highest since 2008, coupled with its best on-time performance since 2015. Such performance enhances customer satisfaction and loyalty, encouraging repeat business and positive word-of-mouth referrals.
Frontier's reimagined FRONTIER Miles℠ loyalty program, launched in 2024, offers travelers the opportunity to earn travel miles and elite status points at an accelerated rate. This program incentivizes frequent travel with Frontier, fostering customer retention and encouraging increased travel frequency among members. By aligning loyalty rewards with passenger spending, the airline strengthens its relationship with customers and drives passenger volume growth.
2. Total Flights Operated
Frontier Airlines' operational strategy emphasizes high aircraft utilization and efficient scheduling to maximize the number of flights operated. In December 2023, the airline achieved industry-leading aircraft utilization on its all-Airbus fleet, averaging over 12 hours per day. This high utilization rate allows Frontier to operate more flights with its existing fleet, increasing overall flight numbers without proportionally increasing costs.
The airline's investment in fleet expansion supports its ability to increase flight frequencies and add new routes. In 2021, Frontier placed an order for 91 Airbus A321neo aircraft, aiming to triple its size by 2029. The introduction of these fuel-efficient aircraft enables the airline to operate longer routes and increase flight frequencies, contributing to a higher total number of flights.
Frontier's focus on operational efficiency extends to its maintenance practices. In 2024, the airline received the FAA Diamond Award of Excellence for its commitment to maintenance training and safety. By ensuring that its maintenance technicians are highly trained and proficient, Frontier minimizes aircraft downtime, allowing for a higher number of flights and improved schedule reliability.
The airline's network strategy also plays a role in increasing flight numbers. By targeting underserved and overpriced markets, Frontier identifies opportunities to introduce new routes and increase flight frequencies where demand is unmet. This approach not only fills market gaps but also allows the airline to operate more flights with higher load factors, optimizing revenue per flight.
Frontier's commitment to environmental sustainability contributes to its operational efficiency. The airline's use of the most fuel-efficient fleet among major U.S. carriers, as measured by ASMs per fuel gallon consumed, allows it to operate more flights with lower fuel costs. These savings can be reinvested into expanding flight operations, further increasing the total number of flights operated.
3. Available Seat Miles (ASM)
In 2024, Frontier Airlines reported a 5% year-over-year increase in Available Seat Miles (ASMs), reaching 39.9 billion, up from 37.8 billion in 2023. This growth reflects the airline's strategic capacity expansion through fleet augmentation and network optimization. The average stage length decreased by 11% to 894 miles, indicating a shift towards shorter-haul routes, which can enhance aircraft utilization and frequency. Despite this, the airline maintained high efficiency, generating 106 ASMs per gallon—a company record and approximately 1% higher than the comparable 2023 quarter—underscoring its commitment to fuel efficiency and environmental sustainability.
The deployment of the Airbus A320neo family aircraft, known for their fuel efficiency, has been instrumental in achieving these ASM metrics. The airline's focus on high-density seating configurations and streamlined operations has allowed it to maximize seat availability without compromising on cost-effectiveness. This approach not only supports increased ASMs but also aligns with Frontier's low-cost carrier model, enabling competitive pricing strategies.
Frontier's network strategy emphasizes underserved markets and secondary airports, facilitating rapid ASM growth. By targeting these markets, the airline can introduce new routes with less competition, optimizing load factors and revenue potential. This approach also allows for flexibility in adjusting capacity based on market demand, contributing to efficient ASM management.
The airline's operational efficiency is further highlighted by its average daily aircraft utilization, which, despite a 9% decrease to 10.3 hours in 2024, remains robust. This metric reflects Frontier's ability to maintain high levels of aircraft productivity, essential for maximizing ASMs and overall operational performance.
Frontier's commitment to environmental sustainability is evident in its ASM achievements. The airline's recognition as the “North American Environmental Sustainability Airline of the Year” by the Centre for Aviation in 2024 underscores its industry-leading emissions reductions and efficiency. Such accolades not only enhance the airline's brand image but also appeal to environmentally conscious travelers, potentially influencing their choice of airline and contributing to increased ASMs.
4. Revenue Passenger Miles (RPM)
In 2024, Frontier Airlines reported a slight decrease of 0.57% in Revenue Passenger Miles (RPMs), totaling 30.59 billion compared to 30.76 billion in 2023. This marginal decline, despite a 5% increase in ASMs, led to a load factor reduction of 4.6 percentage points, settling at 76.8%. The decrease in load factor suggests that the additional capacity introduced was not fully matched by passenger demand, highlighting the challenges of aligning capacity growth with market demand.
The airline's focus on expanding into new markets and increasing flight frequencies may have contributed to the RPM decline, as new routes often require time to mature and achieve optimal load factors. Additionally, the shift towards shorter-haul routes, as indicated by the reduced average stage length, can impact RPMs, as these routes typically generate fewer revenue miles per flight.
Frontier's ancillary revenue strategy, which includes fees for services such as seat selection and baggage, plays a crucial role in offsetting RPM fluctuations. In 2024, the airline reported a total revenue per passenger of $113.38, a 5% decrease from the previous year. This decline reflects changes in passenger behavior and market dynamics, emphasizing the importance of ancillary revenue streams in maintaining overall profitability.
The airline's loyalty program, FRONTIER Miles℠, reimagined in 2024, aims to enhance customer retention and stimulate demand. By offering accelerated earning rates and elite status points, the program incentivizes repeat travel, potentially boosting RPMs over time. Such initiatives are vital for maintaining a steady flow of revenue passenger miles, especially in a competitive market landscape.
Frontier's operational performance, including a record-setting 99.38% flight completion rate in December 2023, contributes to its ability to maintain consistent RPMs. High operational reliability enhances customer satisfaction and loyalty, encouraging repeat business and positive word-of-mouth referrals, which are essential for sustaining and growing RPMs.
5. Passenger Load Factor (%) Analysis
Frontier Airlines concluded 2024 with a full-year passenger load factor of 76.8%, marking a 4.6 percentage point decline from 81.4% in 2023. This decrease reflects a strategic shift in the airline's network, including a reduction in average stage length by 11% to 894 miles, and a 5% increase in Available Seat Miles (ASMs) to 39.9 billion. While these adjustments aimed to enhance operational efficiency and market penetration, they also introduced challenges in aligning capacity with demand, particularly in newly served or expanded markets.
The fourth quarter of 2024 saw a slight improvement, with the load factor increasing to 78.3% from 78.1% in the same period of 2023. This uptick suggests a positive response to Frontier's network simplification efforts and targeted capacity deployment, focusing on peak travel days and high-demand routes. The airline's emphasis on operational reliability, evidenced by a 99.4% completion factor in December 2024, likely contributed to this stabilization in load factors.
Looking ahead, Frontier's strategy to enhance load factors involves a combination of disciplined capacity management and revenue optimization initiatives. By refining its route network and focusing on markets with strong demand elasticity, the airline aims to improve its Revenue Passenger Miles (RPMs) relative to ASMs. Additionally, the introduction of new products and services, such as First Class seating and enhanced loyalty program benefits, is expected to attract higher-yield passengers, further supporting load factor improvements.
6. Financial Performance Analysis
Frontier Airlines reported a record total operating revenue of $3.775 billion for the full year 2024, a 5% increase from $3.589 billion in 2023. This growth was driven by strategic capacity deployment and network initiatives that enhanced Revenue per Available Seat Mile (RASM) by 15% in the fourth quarter, reaching 10.23 cents. The airline's focus on peak travel periods and high-demand routes contributed to this revenue enhancement, despite a 2% reduction in capacity during the same quarter.
Net income for 2024 was $87 million, a significant turnaround from a net loss of $8 million in 2023. This improvement reflects effective cost management, including a 1.2% reduction in adjusted Cost per Available Seat Mile (CASM) excluding fuel, stage length adjusted to 1,000 miles. The airline's operational efficiency, bolstered by a fleet comprised of 82% fuel-efficient A320neo family aircraft, played a crucial role in enhancing profitability.
6.1. Operating Revenue ($) Performance
In the fourth quarter of 2024, Frontier achieved a record quarterly operating revenue of $1.002 billion, a 13.57% increase from $891 million in the same period of 2023. This milestone was accomplished despite a 2% decrease in capacity, highlighting the effectiveness of the airline's revenue and network strategies. The increase in total revenue per passenger to $117, up 6% from the previous year, underscores the success of these initiatives in enhancing passenger yield.
The airline's focus on ancillary revenue streams, including fare and non-fare passenger revenue, contributed to the overall revenue growth. While fare revenue per passenger increased by 26% to $48.40, non-fare passenger revenue per passenger experienced a 5% decline to $65.81. This shift indicates a strategic emphasis on base fare adjustments to drive revenue, complemented by a suite of ancillary offerings to enhance the overall passenger experience.
6.2. Net Income ($) Analysis
Frontier's net income of $87 million in 2024 represents a significant improvement from the $11 million net loss reported in 2023. This positive financial outcome was influenced by a combination of increased operating revenue and disciplined cost management. The airline's adjusted pre-tax margin for the fourth quarter stood at 5.1%, reflecting the success of its strategic initiatives in enhancing profitability.
The airline's liquidity position also strengthened, with total liquidity reaching $935 million by the end of 2024, up from $730 million at the end of 2023. This improvement provides Frontier with greater financial flexibility to navigate market uncertainties and invest in future growth opportunities. The company's focus on maintaining a robust balance sheet positions it well to capitalize on emerging trends in the aviation industry.
Comments ()