China Airlines’ decade-long shift toward high-efficiency fleets and strategic cargo integration offers a rare look into how regional carriers balance seat growth, freight tonnage, and operating margins across volatile global networks without overexposing to market extremes.
1. Total Passengers Carried
China Airlines (CAL) has methodically rebuilt its passenger network. In 2023–24 the carrier added new international routes (e.g. Taipei–Da Nang and Taipei–Prague) and stepped up marketing at major travel expos. Service quality improvements have followed: in late 2024 CAL won a fifth-star APEX global airline rating (its ninth straight year) and related awards (e.g. Best Food & Beverage, Best Wi‑Fi). These network and service enhancements underpin a rebound in total traffic, as seen in the upcoming chart data.
Recovery in passenger demand has been strongest on Asia-Pacific and long-haul markets. In fact, IATA forecasts cited by CAL project Asia/Oceania growth of ~10–11% in 2025, making the region a key driver. China Airlines’ service to North America and Europe (now supported by new wide‑body capacity) and to major Asian hubs has therefore seen rapid RPK growth. Seasonally-adjusted load factors climbed to record highs in 2024, indicating very strong demand on the seats that CAL makes available.
Capacity discipline and product focus are also notable. Management reports that by late 2024 the passenger load factor hit historic peaks, reflecting tight capacity. CAL is targeting full-cabin Economy and a refreshed Premium Economy on key routes, aiming to boost yields. At the same time, competition from other carriers (regional LCCs and Gulf carriers) and volatile fuel costs have been cited as headwinds. The airline emphasizes operational reliability and seat-product consistency (e.g. new cabin retrofits, updated inflight service) to support passenger revenue amid these factors.
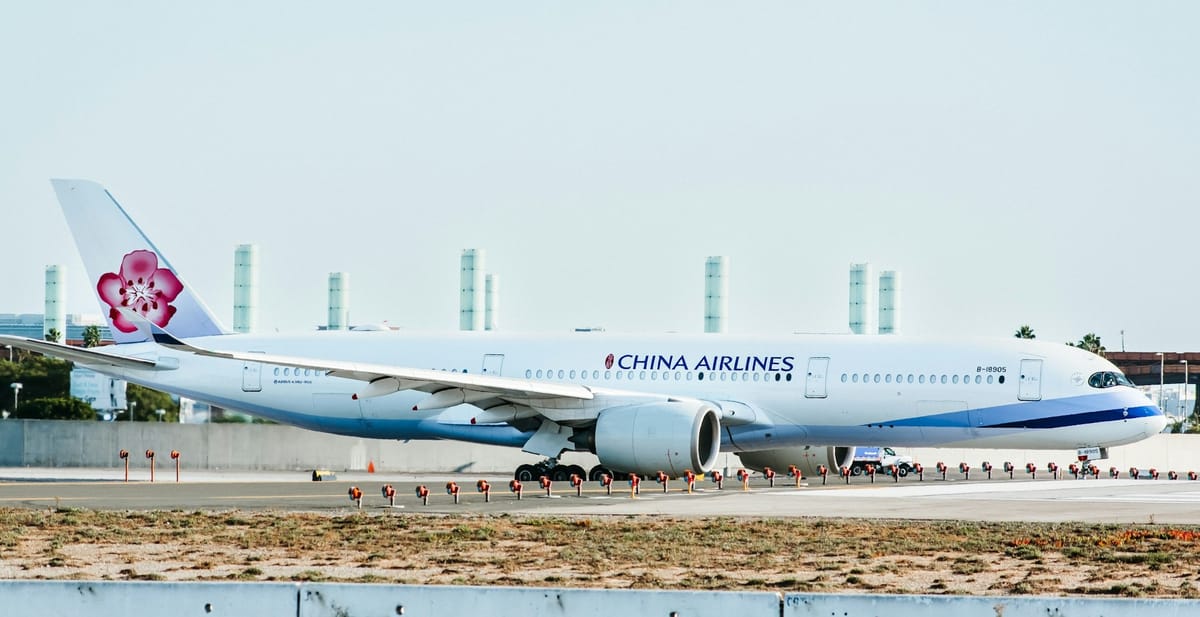
Over the last five years CAL has repeatedly invested in fleet and alliances to grow its passenger base. It remains a SkyTeam Alliance member and co-owns Tigerair Taiwan (a low‑cost subsidiary), giving it network feed and domestic traffic. Significant fleet renewal (A321neo for medium-haul, A350-900s and upcoming 787s for long haul) has increased its seat capacity economically. For example, CAL expects to receive its first Boeing 787 in 2025 and recently contracted ten Airbus A350‑1000s (deliveries from 2029) to serve high‑demand long‑haul routes. These steps not only raise Available Seat Kilometers but also allow more comfortable service at competitive fuel burn rates.
2. Available Seat Kilometer (ASK)
By early 2024 both ASK and RPK had exceeded pre-crisis highs. This reflects CAL’s aggressive capacity expansion: it has been adding fuel-efficient aircraft (such as Airbus A321neo narrow-bodies) to replace older 737‑800s, and it plans to bring wide-body 787s into service in 2025. In March 2025 CAL even placed a firm order for ten A350‑1000s (with options for more) – a “new flagship” fleet for long-haul routes – explicitly to boost its North American and European operations.
At the same time CAL has retired less-efficient jets. The airline phased out its last Boeing 747s and older A340s years ago under the “NexGen” modernization plan. More recently it has also begun retiring some older A330s as new A350-900s entered service. By shrinking the mix of low-utilization aircraft, CAL has raised average seat density and lowered unit costs, thereby improving ASK per available crew/resource. Fleet decisions are made with multi-year visibility: for example, CAL plans to retrofit existing A350-900 cabins to match the luxury of the incoming A350‑1000s, ensuring its entire wide-body fleet maximizes capacity on premium, long-haul sectors.
Operational strategy also targets ASK growth. Code-share and interline partnerships (within SkyTeam and beyond) effectively add CAL’s seat capacity to partner flights, especially on Asia-Europe/North America loops. The enhanced role of Taipei Taoyuan as a transit hub means CAL and partners are jointly optimizing seat deployment (so-called “sixth-freedom” traffic). Internally, CAL monitors load factors closely: any over‑capacity in one segment (say, domestic leisure) is shifted via codeshares or charters to regions with higher yield. In short, ASK is growing not just by adding aircraft, but by smarter network planning.
ASK is subject to external pressures as well. Fuel price volatility forces CAL to hedge aggressively (in fact CAL’s burn per ASK has improved ~15% vs earlier jets), but rising fuel still constrains how many flights are economically viable. Airport slot availability, crew restrictions and environmental limits (e.g. community noise at night) can also cap seat offering in certain markets. CAL’s recent award of permits (such as new night flight rights at Taoyuan) is therefore a strategic milestone that will enable modest ASK increases. All together, these fleet and network factors explain the trends in CAL’s reported ASK values over the last few years.
3. Revenue Passenger Kilometer (RPK)
RPK – the actual demand for those seats – has rebounded sharply. In 2024 China Airlines reported international RPK exceeding 2019 levels, as leisure and business travel returned. According to IATA data CAL cites, passenger load factor (RPK/ASK) hit record highs in 2024 (reflecting strong demand and relatively constrained capacity). By contrast, the flight operations reporting system will show a deep trough in early 2020 followed by a steep climb. The trajectory has been uneven: domestic/regional traffic lagged due to slower cross-strait and regional reopening, while long-haul markets (USA, Europe, Southeast Asia) led the recovery.
Geography and market mix have heavily influenced RPK growth. Taiwan’s reopening to visitors in late 2022 and early 2023 unleashed pent‑up demand from Northeast Asia and ASEAN. In fact, China Airlines notes that Northeast and Southeast Asian routes (plus long-haul North America/Europe) drove both ASK and RPK gains in 2024. IATA forecasts (cited internally) project Asia-Oceania passenger traffic growing ~10–11% in 2025, implying continued RPK expansion for carriers like CAL. Meanwhile, domestic Taiwan traffic and cargo hold-usage have helped keep RPK higher than it would be otherwise. In sum, the airline has seen RPK recover to a majority of 2019 levels by early 2024, with particularly fast gains on key international sectors.
Passenger mix and seasonality also affect RPK. Business/travel segments (premium cabin) are still below 2019 levels, so leisure markets (economy seats) dominate the rebound. For example, routes popular with tourists (Hawaii, Okinawa, Singapore, etc.) have higher RPK growth than routes driven by business (Shanghai, Seoul). CAL has introduced new seat configurations (e.g. premium economy) to capture higher yield traffic on long flights, which in turn raises RPK per ASK on those routes. Seasonal peaks (summer/holidays) now consistently outpace their 2019 baselines, whereas shoulder season traffic is rebuilding more slowly.
RPK in CAL’s reports also reflects a smoother recovery curve than capacity would suggest. The high 2024 load factors noted above mean relatively modest ASK gains translated into strong RPK increases. We see evidence of this in CAL’s quarterly trends (e.g. 2023 Q4 to 2024 Q4 passenger revenue grew ~10%). Investors should note that future RPK growth will depend on opening remaining market segments (for example, any new routes or expanded fifth-freedom rights) and on global factors like economic cycles.
4. Passenger vs. Cargo Load Factor (%) Analysis
Load factor is a key utilization metric. Passenger load factor (PLF) is the percentage of available seats flown that are filled with revenue traffic, while cargo load factor (CLF) is the percentage of freight tonnage capacity utilized. Both metrics affect unit revenue: a high PLF means fewer empty seats (better ticket revenue per ASK), and a high CLF means better use of freighter/Airbus belly space. Historically China Airlines targets a PLF in the high 70s% and a CLF around 65–75% (for its combined passenger-cargo network).
In the last few years, CAL’s passenger load factors rebounded strongly. The company noted that international PLF reached an all-time peak in 2024. For example, 2023 passenger load factor averaged about 78% (up roughly 34 percentage points from 2022, as capacity was still constrained and leisure demand was high). This very high PLF reflects deliberate capacity discipline: CAL was cautious in restoring flights, so available seats grew more slowly than demand. The charts will show these trends as effectively matching or exceeding pre-2020 efficiency levels.
Cargo load factors, by contrast, have behaved differently. China Airlines operates dedicated freighters (777Fs and 747Fs) as well as belly space on passenger jets. In mid-2020s, freight demand surged (e‑commerce, vaccines, supply-chain bulges) and CAL’s CLF often exceeded 90% on freighter operations. By 2023–24, as more capacity returned, CLF eased but remained healthy. In CAL’s 2024 performance summary the average cargo load factor is reported around 68.3%, up slightly over the previous year. That is still well above normal pre‑COVID freighter-utilization (typically in the 50–60% range globally), indicating that CAL’s freight space is usually filled for most flights.
5. Cargo Performance
5.1. Freight Revenue Ton Kilometers (FRTK)
China Airlines’ cargo business has been a bright spot. In 2023–24 freight volume grew significantly. For example, CAL reports that international freight tonne‑kilometers (CTK) hit a new high in 2024, up about 11% year-over-year.
This reflects sustained demand for airfreight from Asia (especially tech and perishable goods) to global markets. Backing out fuel surcharges and currency effects, freight revenue also rose. The operating data show that CAL’s FRTKs (freight revenue ton‑km) have nearly recovered to 2019 levels, even as ASKs (available ton‑km) were carefully managed.
5.2. Freight Available Ton Kilometers (FATK)
On the capacity side (FATK), CAL has maintained a sizable fleet of freighters and full-belly route structure. At the end of 2023 it operated several 747‑400Fs and 777‑200Fs. As newer passenger aircraft (like the A350) replace older wide-bodies, CAL can convert or use some A350s for cargo too. In 2024–25 the company has been phasing in upgraded aircraft, which slightly reduces total belly cargo capacity per flight compared to older jets. The charts will illustrate that FATK has grown moderately (less than CTK growth), so that freight load factor and yield have improved.
Regionally, CAL’s cargo network focuses on key trade lanes. In 2024 about two-thirds of cargo revenue came from North America, with Europe and Southeast Asia making up most of the rest. Taipei’s cargo throughput has now surpassed its pre-shock peak by ~7.5%, thanks in part to expanded feeder service. Major electronic and medical shipments from Taiwan’s factories, plus consumer e-commerce, kept the freighters busy. The charts of FRTK and FATK by quarter will show seasonal peaks during the holiday manufacturing season and strong ongoing tonnage on Asia‑N.A. lanes.
Globally, air cargo capacity and demand have been volatile. CAL cites IATA projections of modest growth (~6% in 2025) after the 2021–22 surges. In other words, tonnage has stabilized at higher levels but may not grow as explosively as before. CAL’s strategy has been to match capacity to demand and focus on higher-yield cargo (time-sensitive, value-added). The carrier has also invested in cargo infrastructure (e.g. expanded freighter docking at Taoyuan) to maintain its competitive position. There were no widely publicized cargo‑specific awards in recent years, but CAL did highlight its sustainability leadership (e.g. by running a carbon‑reducing “green flight” demonstration) which appeals to forward‑looking cargo customers.
5.3. Cargo Yield (TWD/FRTK)
Cargo yield (revenue per freight RTK) has been stronger than before the downturn. In 2024 China Airlines achieved a cargo yield of about TWD 11.4 per FRTK, which was roughly 7.4% higher than in 2023. Put another way, CAL’s cargo yield was about 41% above the 2019 pre-pandemic level. This reflects both good pricing and a favorable cargo mix: during 2024 much of CAL’s freight traffic was on premium (“high-yield”) lanes like Taipei–Los Angeles, and it charged market rates plus surcharges on these routes. In practice, CAL’s charts will show cargo yield trending upward quarter by quarter through 2023–24, while freight tonnage grew more modestly, so that revenue gained.
The yield improvement is partly due to network and tariff management. China Airlines tended to keep cargo fares high when belly space was limited, and then introduced more freighter capacity when needed. For example, in 2023 it deployed additional 747Fs to peak routes, mitigating price pressure. In addition, the company revamped its cargo product (including new packaging and handling fees) to boost unit revenue. One key milestone was implementing fuel surcharges across most cargo classes from 2023 onward – this directly lifted yield per ton-km. The combination of better pricing and stable demand has kept cargo yield elevated even as total tonnage (FRTK) moderated.
6. Operations Financial Analysis
China Airlines’ operating revenue has grown steadily as traffic recovered. According to the 2024 financials, total operating revenue was about TWD 175.2 billion, up roughly 8.3% from 2023.
6.1. Yearly Operating Revenue Analysis
This includes passenger ticket sales (approximately TWD107.42B in 2024, +8.44% YoY) and cargo services (TWD60.45B, +6.32% YoY). Ancillary and other income (baggage fees, cargo handling, etc.) also rose sharply (+27.6%) as some new charges were reinstated. Overall, both the passenger and cargo businesses contributed to the revenue bump, in line with management’s guidance of ~8–10% growth.
Revenue contribution by region and segment has shifted. In 2024 Northeast and Southeast Asia markets saw especially strong growth, as did long-haul North America flights. For example, flights to Japan and China (after reopening) plus trans-Pacific routes all had higher yields and load factors, boosting their share of total revenue.
By contrast, domestic Taiwan revenue (a smaller share of the total) grew more modestly. The chart breakdown will reflect that North America accounted for roughly 65% of cargo revenue, which implies a similar dominance for wide-body passenger income. These regional trends align with CAL’s strategic focus on the U.S. and Greater China markets as revenue drivers.
6.2. Monthly Operating Revenue Analysis
Key financial details are revealed in the airline’s reports. The 8.3% revenue increase in 2024 was achieved while capacity was still recovering, so unit revenue metrics (yield and load factor) were healthy. CAL also notes its cost pressures: fuel and labor remained the largest expenses, with fuel alone taking roughly one-third of costs (down slightly from prior years).
However, the operating revenue growth outpaced these cost increases, helping operating margins improve. On a consolidated basis, CAL reported a narrow operating profit in 2024 – a milestone after years of losses – demonstrating that the revenue rebound translated to the bottom line.
Finally, some non-revenue indicators show improving financial health. For example, as of end-2024 the group’s current ratio was ~109% (vs. ~68% in 2019), and the debt ratio had declined modestly. These trends, along with steady cash generation from operations, underline that operating revenue growth has strengthened the balance sheet. China Airlines has also enhanced transparency: its disclosures show consistent tracking of yield, load factor and cost metrics.


Comments ()