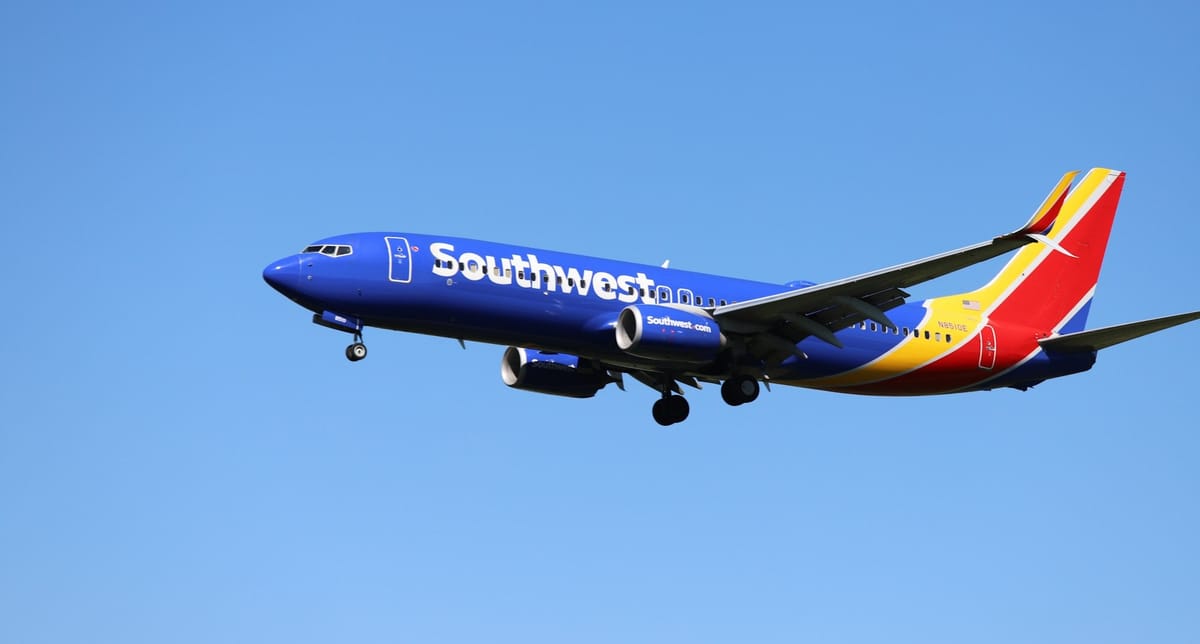
A thorough evaluation of Southwest Airlines' operational & financial performance, including passenger numbers, flights, ASM, RPM, load factor, and a breakdown of revenue and net income, providing a deeper understanding of the airline’s efficiency and financial stability.
1. Total Passengers Carried
In 2023, Southwest Airlines carried approximately ∼172 million revenue passengers, positioning it among the top three U.S. carriers by volume. This figure reflects a recovery trajectory following the pandemic-induced downturn, where passenger numbers dropped to ∼70 million in 2020. The airline's point-to-point network model, emphasizing nonstop routes, has been instrumental in facilitating this rebound, with 73% of customers flying nonstop in 2023 .
A significant regulatory development impacting passenger volumes was the repeal of the Wright Amendment in 2014. This change allowed Southwest to offer long-haul nonstop flights from Dallas Love Field, expanding its reach and contributing to increased passenger traffic through this central hub. The strategic shift enabled the airline to tap into previously restricted markets, aligning with its growth objectives.
Operational challenges have also influenced passenger transport metrics. Notably, in December 2022, Southwest experienced a scheduling crisis resulting in the cancellation of over 15,000 flights. This disruption, attributed to a combination of severe winter weather and outdated crew scheduling systems, led to a $140 million fine by the U.S. Department of Transportation . Such events underscore the importance of robust operational infrastructure in maintaining passenger service levels.
Despite these challenges, the airline demonstrated resilience, achieving a record summer performance in 2024 by transporting over 54 million customers across more than 414,000 flights, with a 99.3% completion factor. This performance indicates a strong recovery and operational efficiency during peak travel periods.
Southwest's focus on domestic markets continues to define its passenger transport strategy. While international operations have expanded to include destinations in Mexico, Central America, and the Caribbean, domestic routes remain the core of its business model. This emphasis aligns with the airline's operational strengths and market positioning within the U.S. aviation sector.
2. Total Flights Operated
Southwest Airlines' flight operations are characterized by high-frequency, short-haul services. In 2021, the airline operated approximately ∼1.07 million flights, averaging nearly ∼3,000 flights per day . This volume reflects the carrier's commitment to providing extensive connectivity across its network.
The airline's fleet strategy supports this operational model. As of 2025, Southwest operates an all-Boeing 737 fleet comprising 801 aircraft, with plans to transition to an all-737 MAX fleet by 2031 . The uniformity of the fleet simplifies maintenance and crew training, contributing to operational efficiency and flexibility in scheduling.
Southwest's network design, blending point-to-point and hub-and-spoke elements, facilitates a high volume of flights with minimal reliance on central hubs. In 2023, the airline served 805 nonstop city pairs, with an average aircraft trip length of 730 miles and a duration of approximately two hours . This structure enables the airline to maintain a dense schedule of short-haul flights, catering to a broad customer base.
Operational performance metrics further highlight the airline's flight management capabilities. In the summer of 2024, Southwest achieved a 99.3% flight completion factor, indicating a high level of reliability during peak travel seasons . Such performance is critical in maintaining customer trust and operational credibility.
However, the airline has faced scrutiny over scheduling practices. In 2025, the U.S. Department of Transportation filed a lawsuit alleging that Southwest operated chronically delayed flights with unrealistic schedules . The case was later dropped, but it highlights the regulatory attention on flight punctuality and scheduling integrity within the industry.
3. Available Seat Miles (ASM)
In 2024, Southwest Airlines reported 177.25 billion available seat miles (ASMs), a 4.1% increase from 170.32 billion in 2023. This growth reflects the airline's strategic capacity expansion, despite challenges such as delayed aircraft deliveries from Boeing. Notably, the airline adjusted its fleet growth plans due to these delays, impacting its capacity projections.
The airline's average aircraft stage length increased to 763 miles in 2024 from 730 miles in 2023, indicating a strategic shift towards longer routes. This change contributed to the increase in ASMs, as longer flights generate more seat miles.
Despite a slight decrease in trips flown—from 1,459,419 in 2023 to 1,443,850 in 2024—the total seats flown remained relatively stable, with a marginal decrease of 1.07%. This stability suggests improved aircraft utilization and efficiency in scheduling.
Southwest's ASM growth aligns with its position as the fifth-largest airline globally by capacity, trailing behind United, American, Delta, and Emirates.
The airline's focus on increasing ASMs, particularly through longer stage lengths and efficient fleet utilization, underscores its commitment to enhancing capacity while navigating operational challenges.
4. Revenue Passenger Miles (RPM)
In 2024, Southwest Airlines achieved 142.52 billion revenue passenger miles (RPMs), marking a 4.6% increase from 136.26 billion in 2023. This growth indicates a rebound in passenger demand and effective capacity deployment.
The average length of passenger haul increased to 1,018 miles in 2024 from 993 miles in 2023, reflecting a strategic emphasis on longer routes. This shift contributed to the rise in RPMs, as passengers traveled greater distances on average.
Despite a slight decrease in revenue passengers carried—from 171.81 million in 2023 to 175.46 million in 2024—the increase in average haul length compensated, resulting in higher overall RPMs.
The load factor, representing the percentage of available seating capacity filled with paying passengers, improved to 80.4% in 2024 from 80.0% in 2023. This enhancement indicates more efficient utilization of available capacity.
Southwest's RPM growth, coupled with increased load factors and longer average hauls, demonstrates the airline's strategic focus on optimizing revenue generation through effective capacity management and route planning.
5. Passenger Load Factor (%) Analysis
In 2024, Southwest Airlines reported a passenger load factor of 80.4%, a slight increase from 80.0% in 2023. This metric, representing the percentage of available seating capacity filled with paying passengers, indicates a stable demand environment and effective capacity management. The marginal improvement suggests that the airline maintained a balance between supply and demand, optimizing aircraft utilization without significant overcapacity .
The airline's point-to-point network model, emphasizing nonstop routes, contributes to its consistent load factors. By reducing the need for connecting flights, Southwest can attract passengers seeking direct routes, thereby enhancing seat occupancy rates. Additionally, the uniformity of its fleet, consisting solely of Boeing 737 aircraft, allows for operational flexibility and efficient scheduling, further supporting stable load factors .
However, external factors such as economic fluctuations and unforeseen events can impact load factors. For instance, in early 2025, the airline adjusted its revenue per available seat mile (RASM) expectations due to factors like higher completion factors and reduced government travel, which could indirectly influence load factors . Monitoring these variables remains crucial for maintaining optimal load factors.
6. Financial Performance Analysis
In 2024, Southwest Airlines achieved record operating revenues of $27.5 billion, reflecting a robust recovery in travel demand and effective revenue management strategies. The airline reported a net income of ∼$465 million, indicating profitability amidst operational challenges and market fluctuations .
6.1. Operating Revenue ($) Performance
Southwest's operating revenue reached a record $27.5 billion in 2024, marking a significant increase from previous years. This growth is attributed to strong travel demand, particularly during peak seasons, and the airline's tactical initiatives to optimize revenue streams .
The airline's revenue per available seat mile (RASM) saw an 8.0% year-over-year increase in the fourth quarter of 2024, driven by enhanced revenue management and pricing strategies. These efforts allowed Southwest to maximize revenue on existing capacity, even as it faced challenges like aircraft delivery delays .
Southwest also benefited from a diversified revenue base, including freight and other ancillary services, which contributed to overall revenue stability. The airline's ability to adapt its offerings and capitalize on market opportunities played a role in its financial performance .
However, it's important to note that in early 2025, the airline adjusted its RASM expectations due to factors such as reduced government travel and external events like California wildfires, highlighting the sensitivity of revenue performance to external variables .
6.2. Net Income ($) Analysis
Southwest Airlines reported a net income of $465 million for 2024, demonstrating a return to profitability following the challenges posed by the COVID-19 pandemic. This figure reflects the airline's efforts to manage costs and adapt to changing market conditions .
The airline's net income was supported by strategic initiatives, including cost reduction programs and fleet optimization. Southwest's focus on operational efficiency and prudent financial management contributed to its positive bottom line .
Additionally, the airline maintained strong liquidity, with $9.7 billion in liquidity reported at the end of 2024, exceeding its debt obligations. This financial position provided Southwest with the flexibility to navigate uncertainties and invest in future growth .
Looking ahead, Southwest's financial performance will depend on its ability to manage operational challenges, adapt to market dynamics, and continue executing its strategic initiatives effectively.
Comments ()