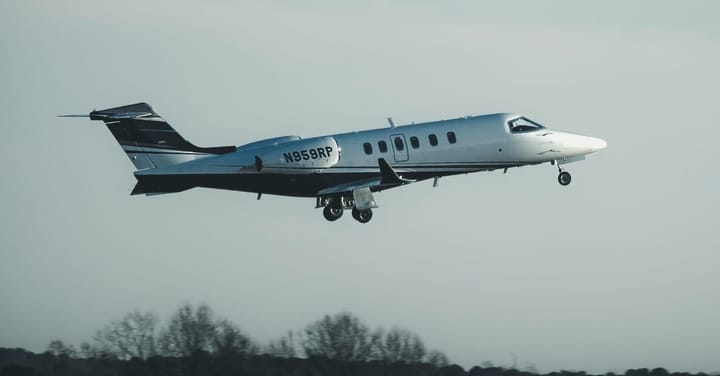
Compare the long-term financial impact of leasing versus buying an aircraft with this tool by inputting key variables to generate detailed cash flow and NPV analyses. Use the side-by-side comparison to make data-driven decisions that optimize fleet investment and operational costs.
About This Tool ⬆
The Lease vs Buy Aircraft Financial Analysis Tool is an interactive, decision-support calculator designed to assist flight operators, fleet managers, operations teams, investors, financial stakeholders, and aviation directors in evaluating the long-term economic impact of leasing versus purchasing a business jet.
This tool is intended for professionals involved in aircraft acquisition planning, providing a transparent, year-by-year comparison of cash flows and net present values (NPVs) for both lease and purchase scenarios over a defined term. It’s particularly valuable in flight ops contexts where capital deployment, tax exposure, and lifecycle costs are critical factors in long-term fleet decisions.
⚠️ Disclaimer: This tool provides projected cost comparisons based on user-defined assumptions and inputs. Aero Sync offers these results as reference only. Final acquisition decisions should always involve consultation with qualified financial advisors, aviation tax professionals, or lease consultants.
📊 What It Does?
This tool provides a structured financial analysis to compare the long-term cost implications of leasing versus purchasing a business jet. By modeling both acquisition paths in parallel, the tool delivers a side-by-side evaluation based on key financial metrics.
Specifically, it calculates:
• Total Cash Flow (Year-by-Year): Projects all relevant cash outflows (and inflows, such as residual value) over the analysis period for both leasing and buying options.
• Cost per Flight Hour: Computes the fully burdened cost per operational hour by dividing total costs by the total flight hours, allowing for normalized performance benchmarking.
• Tax Impact Analysis: Incorporates tax savings from deductible items—such as depreciation (for ownership), interest expense (on financed amounts), and lease payments (in the leasing model)—to reflect true after-tax costs.
• Net Present Value (NPV): Applies the user-defined discount rate to future cash flows in both scenarios, presenting a present-value comparison that supports capital efficiency analysis.
• Scenario Comparison Output: Clearly identifies the more cost-effective option based on NPV, and dynamically visualizes the yearly cash flow difference through a side-by-side bar chart, enabling intuitive interpretation of financial behavior over time.
This level of insight allows flight departments and operational leadership to make well-informed, data-driven decisions aligned with their financial strategy and fleet utilization goals.
🔧 Key Inputs & Parameters — Detailed Breakdown
To generate accurate and meaningful comparisons, users must populate the tool with realistic inputs reflective of their operational and financial environment. Below is a detailed explanation of each parameter:
🟦 General Inputs
• Term (Years): This is the total duration over which the lease or ownership costs will be evaluated. It typically reflects the expected usage period or contract term for the aircraft (e.g., 5–10 years). All cash flow and NPV comparisons are calculated over this timeframe.
• Discount Rate (%): Represents the user's cost of capital or required rate of return. It's used to discount future cash flows back to present value, allowing a time-value-of-money comparison. This figure can be based on corporate hurdle rates or financing expectations.
• Tax Rate (%): The applicable corporate or marginal tax rate for your operation. It determines the level of tax savings derived from deductible expenses like depreciation, loan interest, or lease payments.
• Annual Flight Hours: The estimated number of flight hours per year. This input is used to calculate the cost per flight hour for each scenario—an essential efficiency metric for comparing ownership versus leasing under operational usage.
🟩 Purchase Scenario Inputs
• Purchase Price & Down Payment (% or $): The purchase price is the full capital cost of acquiring the aircraft. The down payment can be entered as a fixed dollar value or percentage of the purchase price. It defines the equity portion paid upfront, with the remaining amount assumed to be financed.
• Loan Terms:
– Interest Rate (%): The annual interest applied to the loaned portion of the purchase price.
– Loan Term (Years): The amortization period over which the loan is paid back. These inputs influence the annual loan payments and total interest cost over time.
• Annual Operating Costs ($): All recurring expenses involved in operating the aircraft each year, such as maintenance, crew salaries, insurance, fuel, and hangar/storage costs. These costs directly impact the total ownership cash flow.
• Residual Value at End of Term ($): The projected market value of the aircraft at the end of the evaluation period. This value is credited back in the final year of the ownership model, reducing the total cost of ownership.
🟨 Lease Scenario Inputs
• Annual Lease Payment ($) & Escalation Rate (%): The annual lease payment is the base cost of leasing the aircraft. The escalation rate reflects how this payment increases annually (due to inflation, CPI indexing, or contractual clauses). Together, these define the total lease cash flow over time.
• Annual Operating Costs ($): Similar to the ownership case, this includes all annual expenses related to operating the aircraft under a lease agreement. These may differ slightly depending on lease terms (e.g., power-by-the-hour provisions).
• End-of-Term Fee ($): Any payment due at the conclusion of the lease term, including buyout options or return-condition fees. This is added to the final year’s lease cash flow projection.
These inputs combine to form the cash flow timeline for each scenario. The tool processes this data to produce year-by-year outputs, total lifecycle costs, and comparative financial metrics—such as NPV and cost per flight hour—making it easier to evaluate which path aligns best with your operational and capital strategy.


Comments ()