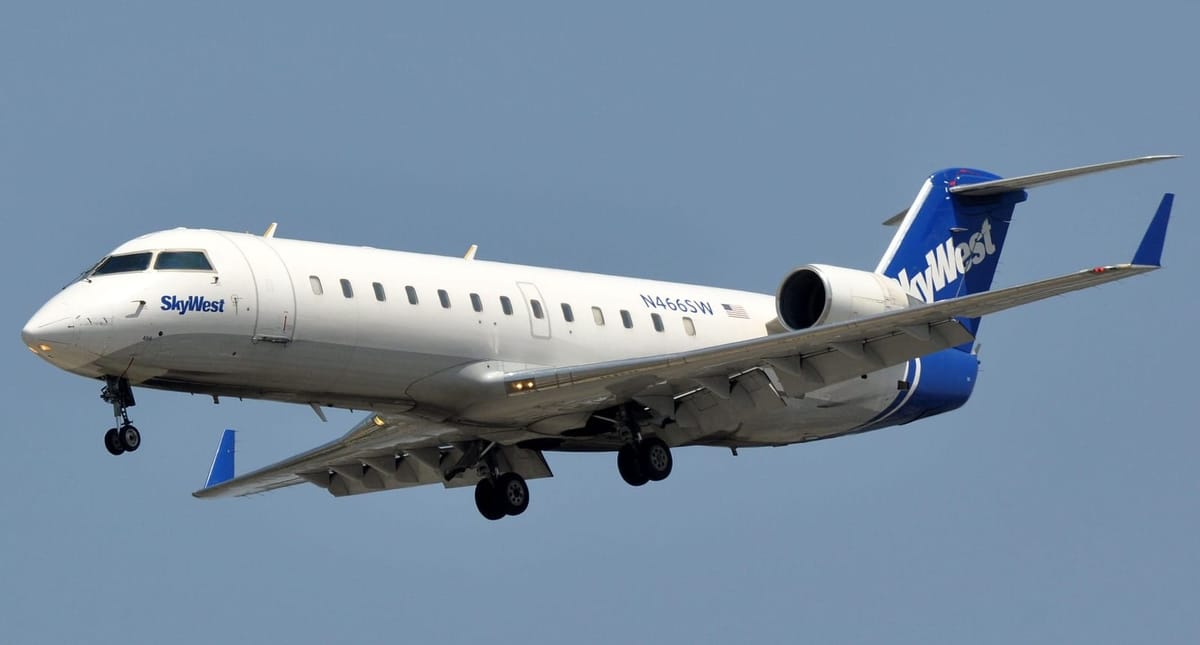
SkyWest operates nearly 500 regional jets, expanding its Embraer E175 fleet and strengthening multi-carrier partnerships. Focused on efficient fleet use and workforce planning, it maintains operational resilience and scalable contract flying across key U.S. hubs.
1. Total Passengers Carried
SkyWest carried roughly 38.5 million passengers in 2023, about 3.8% fewer than the ~40 million in 2022. This decline partially reflects network adjustments after peak pandemic recovery. In 2024, passenger volume rebounded strongly: official releases note “carrying more than 42 million passengers in 2024”. SkyWest’s fleet of nearly 500 regional jets connects about 240 + destinations, supporting this scale. For example, a mid‑2024 fact sheet highlights 38.5 M passengers carried in 2023 with ~500 planes serving 249 destinations
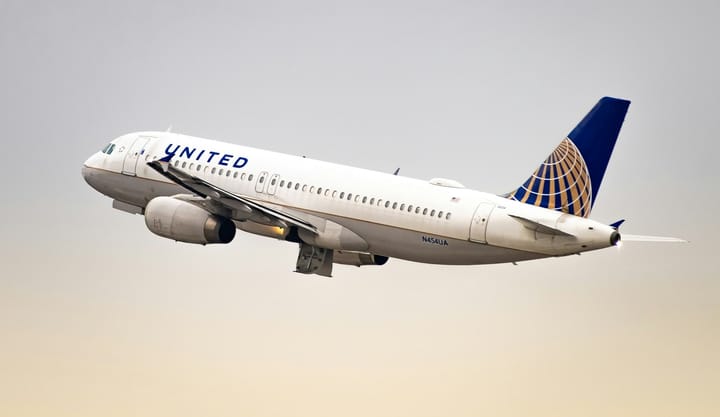
SkyWest’s code-share alliances drive much of this traffic. It operates as United Express, Delta Connection, American Eagle and Alaska SkyWest. Nearly 40 million annual passengers reflects this partnership model. Indeed, media recognize SkyWest as the largest North American regional airline by passengers and fleet. In 2024 SkyWest was the only regional on TIME Magazine’s “Best Mid-Size Companies” list, citing “reliably connect[ing] nearly 40 million passengers each year”.
Seasonal trends also shape passenger counts. Summer schedules and holiday travel can push quarterly volumes higher, especially as SkyWest adds flights. For instance, Q4 2023 carried 9.88 million passengers (up 5.2% YoY) as holiday demand rose. Over longer horizons, SkyWest has steadily expanded its network. Fact sheets note it serves ~250 cities across the US, Canada and Mexico with about 46 shared “stations”. Broader connectivity (e.g. new routes) and steady demand keep passenger totals high.
Milestone achievements punctuate these totals. For example, SkyWest’s leaders tout reliability: in 2023 the airline achieved 300 days of 100% completion of controllable flights, an industry-leading performance. This reliability supports the high passenger count. Moreover, SkyWest’s fleet renewals (detailed below) add capacity to carry more people efficiently. In short, millions of passengers per year reflect both SkyWest’s extensive network and its operational dependability.
2. Total Flights Operated
SkyWest’s total departures (flights) closely track its capacity. In 2023 it operated about 701,689 departures, down ~5.8% from 744,717 in 2022. That annual figure equates to ~1,922 flights per day on average. By 2024, departures climbed again: the company reports 777,900 departures for calendar 2024, a ~10.9% increase. Most flights are high-frequency turnarounds on behalf of the major airlines (e.g. hundreds daily to hubs like Chicago or Salt Lake City).
These flight counts reflect network strategy. SkyWest operates a mix of mainline-feeder routes, so growth or contraction in partner contracts shows up here. For example, in Q4 2024 flights increased as pilot staffing improved: block-hour production was up 20% year-over-year, enabling more departures. In 2023 there were 180,275 flights in Q4 (vs 169,824 in Q4 2022). The full-year totals above include these seasonal variations.
Operational reliability is also high. SkyWest reports a 99.9% adjusted flight completion rate, meaning virtually all scheduled departures take place as planned. (Raw completion including weather is ~98.8% in 2023.) For investors, this indicates disciplined operations: even as total flights fluctuate (due to fleet cycles or demand), SkyWest maintains consistent execution. Notably, 300 days of 100%-completion in 2023 underscores this stability.
Milestones in flight operations include fleet adjustments. For example, as older CRJ-200 jets retire, schedules are reshaped. The introduction of larger Embraer E175 aircraft (discussed below) means each flight can carry more seats. Therefore, total flights might not grow as fast as passenger totals. Even so, SkyWest’s flight count is in the high hundreds of thousands per year, reflecting an all-jet, dense network.
Looking ahead, SkyWest expects to maintain or modestly grow flight activity. In October 2024 it announced 20 additional United Express flights with new aircraft. Regulatory filings also show stable year-round activity. Overall, SkyWest’s departures (~700k in 2023, ~778k in 2024) illustrate the airline’s massive regional schedule, one of the largest by flights of any U.S. operator.
3. Available Seat Miles (ASM)
Available Seat Miles (ASM) measure capacity. SkyWest’s ASM grew strongly in 2024. The company reported 24.855 billion ASM for 2024. This reflects added aircraft and higher utilization. ASM increases when more seats are flown (longer routes or more frequencies).
The ASM trend ties directly to fleet changes. SkyWest has been adding larger jets (especially 76-seat Embraer 175s) and retiring smaller CRJs. For instance, in 2024 SkyWest took delivery of 25 Embraer E175 jets (primarily for United Express). By early 2025 it plans about 488 aircraft in service. More and larger aircraft mean higher ASM. Indeed, planned fleet expansion (278 E175s by 2026) will further boost ASM in coming years.
Economically, SkyWest’s ASM indicates its growth potential. For 2024, higher ASM allowed flying nearly 42 M passengers (RPM ~20.3B). Prior to 2020, SkyWest’s annual ASM was closer to 25–26B; the recent rebound above 24B suggests it has recovered pre-pandemic capacity. The airline adjusts ASM based on market demand and partner needs: when majors need more regional flying, SkyWest adds flight hours and thus seats. Conversely, ASM dipped in early pandemic and 2022 relative to 2019, but the 2024 figure shows a strong recovery.
On the cost side, ASM growth dilutes fixed costs but raises fuel and maintenance expenses. In late 2023, pilots’ contract changes and better attrition helped expand block hours (a proxy for ASM) by 20% in Q4. This drove up 2024 ASM and revenue. For investors, tracking ASM is key: it shows how SkyWest is deploying its fleet. The rise to ~24.85B ASM in 2024 signals aggressive capacity growth aligned with partner contracts.
4. Revenue Passenger Miles (RPM)
Revenue Passenger Miles (RPM) capture demand – essentially how far paying passengers fly. In 2024 SkyWest reported 20.2 billion RPM. Given 24.85B ASM, that yields a load factor ~81.2%, consistent with internal reports of ~82.8% for 2024. The RPM growth roughly paralleled passenger growth: on average, each of SkyWest’s tens of millions of passengers flew several hundred miles, summing to ~20 billion revenue miles.
Comparing years, RPM in 2023 can be estimated. With 38.43M passengers at an average trip length of ~453 miles, RPM was on the order of 17.5 billion. Thus, RPM likely grew ~15–20% in 2024 (to 20.21B) as route lengths and load factor rose slightly. This implies not only more seats flown (ASM), but also marginally fuller cabins. Strong RPM growth indicates healthy demand – more people and/or longer trips on SkyWest flights.
Factors affecting RPM include route network and partner strategy. For example, adding longer routes (say to remote hubs) increases RPM faster than just adding short hops. SkyWest’s network is weighted toward hub connections, so its average trip length (~453 miles) is moderate. RPM also reflects fare mix: as a contract carrier, SkyWest revenue is largely fixed-fee, but higher RPM suggests more block hours under contract. Press releases for 2024 attribute revenue gains partly to “flying contract rate increases” and increased utilization.
From an industry standpoint, RPM trending back toward 2019 levels is significant. Before COVID, regional carriers flew many billions of RPM; hitting ~20B in 2024 indicates near-full recovery of traffic. RPM directly drives revenue in regional agreements (often on a “cost per block hour” or “cost per RPM” basis), so higher RPM helped lift SkyWest’s 2024 revenue about 20% above 2023.
5. Passenger Load Factor (%) Analysis
SkyWest’s PLF has consistently been in the low-80s (%). The airline reported 83.6% PLF in 2023 (up slightly from 83.4% in 2022), indicating that about 5 out of 6 seats were filled on average. In 2024, PLF was ~82.8%. That slight dip reflects that capacity growth (ASM) outpaced RPM growth as the fleet expanded.
These high-80s load factors are strong for a regional carrier. By comparison, many U.S. mainline airlines see PLFs in the 80–90% range. For SkyWest, sustaining ~83% means it is loading its regional jets efficiently. This is partly by design: regional codeshare flights often serve connecting traffic to major hubs, so seats rarely fly empty. Slight PLF changes can come from seasonal or network shifts – for instance, SkyWest added significant capacity in 2024, temporarily lowering PLF.
Load factor trends also reflect fleet mix. As SkyWest replaced smaller CRJs with larger Embraer 175s, it could carry more seats on the same routes. The marginal drop in PLF from 83.6% to 82.8% (2023→2024) shows the network had room to grow: new seats were filled to a similar degree. In any case, PLFs above 80% suggest effective matching of supply and demand. Ultra-high PLF could indicate under-capacity (overcrowding), while very low PLF would signal excess capacity. SkyWest’s consistent ~83% means its planning generally avoids these extremes.
6. Financial Performance Analysis
6.1. Operating Revenue ($) Performance
SkyWest’s operating revenues have followed capacity trends. For the full year 2023, total operating revenue was $2.385 billion, slightly below the prior year’s $2.492B (2022). This modest year-on-year revenue decline (~4.3%) reflected lower flying hours and the hangover of pandemic-era adjustments. However, in 2024 revenue surged to $2.881 billion – an increase of ~20%. Much of this jump came from higher contract rates with major partners and the extra flying (more block hours) in the post-recovery market.
Breaking out sources, nearly all revenue is from “flying agreements” – essentially the fees from United, Delta, etc. Q4 2024 revenues were $780.2M, up from $605.7M in Q4 2023. Full-year contract revenues (the vast majority of total) similarly rose. This suggests that after a lull in 2022–23, SkyWest effectively renegotiated or benefited from higher flying rates, and ramped up utilization. In the earnings release, management pointed to “flying contract rate increases” and deferred revenue recognition as reasons for the higher 2024 revenue base.
Looking back, 2021–22 saw unusual swings (pandemic recovery, government subsidies, etc.), but by 2023 and 2024 the company returned to normal contracting. The steady climb to $2.881B in 2024 means SkyWest is now generating roughly similar scale revenue to the pre-COVID era. For investors, the key is that revenue is again on an upward trajectory, driven by core flying contracts rather than subsidies.
6.2. Net Income ($) Analysis
SkyWest’s profitability mirrors the revenue and capacity patterns. In 2023 the airline recorded a net loss of $104.4 million, down from a net loss of $22.5 million in 2022. This extended loss (on roughly $2.935B in revenue) reflected rising costs and lower operational efficiency. However, 2024 saw a clear recovery: net income reached $107.1 million, a swing of over $211 million. This reversal was supported by stronger flight volumes and improved labor utilization.
Key drivers of the 2024 profit surge included the revenue growth noted above and higher block-hour production. Unlike earlier years, there was no outsized impact from deferred revenue recognition, suggesting that operational improvements were the primary factor. Underlying operating income also rose: SkyWest was able to match partner demand more effectively and contain non-fuel costs. Thus, increased aircraft utilization and restored network scale helped return the airline to profitability.
The swing in net income is also tied to investment and strategy changes. The 2024 profit coincides with ongoing fleet modernization, particularly through additional E175 deliveries. Management framed the result as evidence of contract stability and operational turnaround. One could note that the difference between 2023 and 2024 net results—over $211 million—reflects not just recovery, but the degree to which SkyWest’s model depends on full deployment of assets and partner alignment.
Comments ()