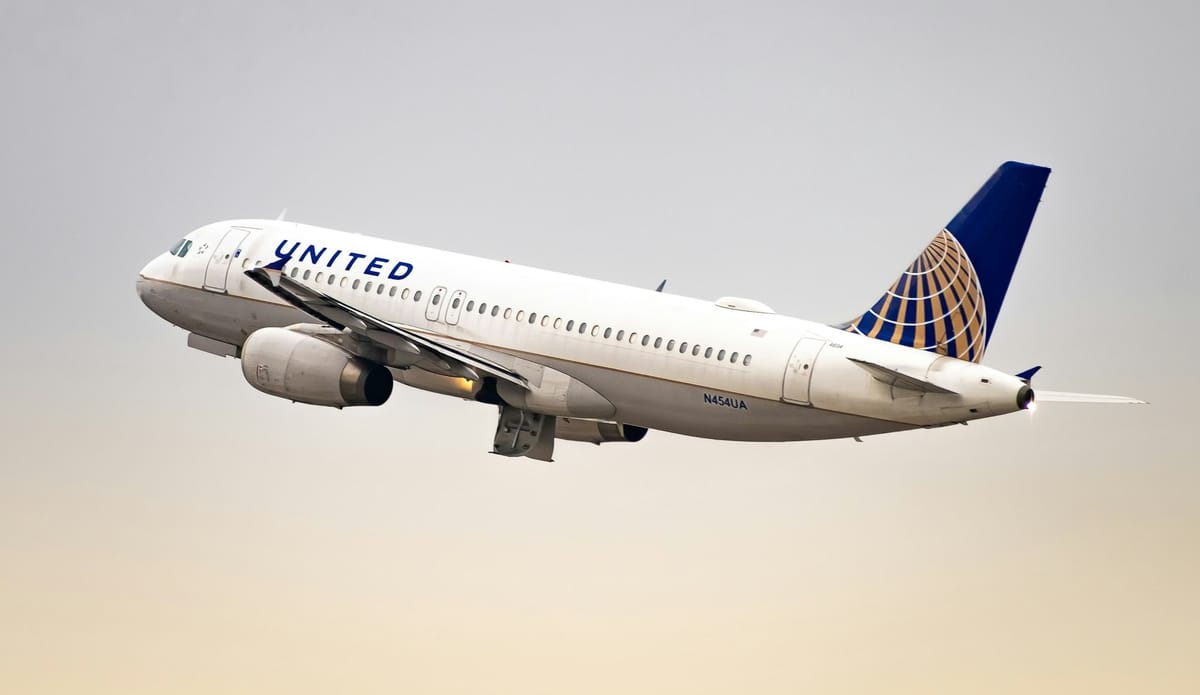
A comprehensive overview of United Airlines' operational and financial performance, including total passengers transported, flights operated, available seat miles (ASM), revenue passenger miles (RPM), passenger load factor, and a detailed financial analysis of operating revenue and net income
1. Total Passengers Carried
United Airlines experienced a significant rebound in passenger traffic post-pandemic, transporting 165 million passengers in 2023—a 14.3% increase from 2022. This growth was supported by a consolidated load factor of 83.9%, reflecting efficient capacity utilization. The airline's strategic focus on both domestic and international markets contributed to this resurgence, with domestic operations achieving an 85.1% load factor and international routes at 82.4% .
In 2024, United continued its upward trajectory, carrying 174 million passengers, marking a 5.5% year-over-year increase. This growth aligned with a 6.0% rise in capacity, reaching 212.9 million available seat kilometers (ASKs) . The airline's emphasis on expanding international routes, particularly to Europe and Latin America, played a pivotal role in accommodating the increased passenger demand.
United's network expansion included operating nearly 700 international flights daily to 133 destinations across 67 countries in 2024, representing the largest international schedule among U.S. carriers by available seat miles. This international focus complemented the airline's robust domestic operations, which encompassed 1.3 million flights to over 200 cities, including the introduction of more than 30 new routes .
The airline's strategic hub utilization, particularly at Chicago O'Hare, Denver, and Newark, facilitated efficient passenger flow and connectivity. Notably, Denver served as United's largest base, with over 55% of traffic connecting through the airport . This hub-and-spoke model enabled the airline to optimize route networks and manage capacity effectively across its system.
United's investment in fleet modernization and customer experience enhancements, such as the introduction of the Polaris business class, contributed to attracting premium passengers and increasing revenue per available seat mile (RASM). These initiatives, combined with strategic route planning and capacity management, positioned United to capitalize on the recovering demand for air travel and maintain a competitive edge in both domestic and international markets.
2. Total Flights Operated
In 2024, United Airlines operated a total of 1,618,842 flights, marking a 6.1% increase compared to the previous year. This expansion reflected the airline's strategic efforts to meet rising passenger demand and restore its network to pre-pandemic levels . The increase in flight operations was supported by the addition of new routes and increased frequencies on existing ones, particularly in high-demand markets.
The airline's domestic operations saw significant growth, with 1.3 million flights serving over 200 cities in 2024. This included the introduction of more than 30 new routes, enhancing connectivity across the United States . The expansion of domestic services was instrumental in capturing market share and accommodating the surge in leisure and business travel.
Internationally, United maintained its position as a leading U.S. carrier by operating nearly 700 international flights daily to 133 destinations across 67 countries in 2024. This extensive international schedule, the largest among U.S. carriers by available seat miles, underscored the airline's commitment to global connectivity and its strategic focus on high-growth international markets .
United's operational efficiency was further demonstrated by its record-setting performance during peak travel periods. In the last two weeks of December 2023, the airline flew 8.2 million customers, averaging 483,000 passengers per day, marking the busiest travel period in its history . This achievement highlighted United's capability to scale operations effectively during high-demand periods.
The airline's fleet modernization efforts, including the integration of new aircraft and the retirement of older models, played a crucial role in supporting the increased number of flights. As of April 2025, United's fleet comprised 1,027 mainline aircraft, the largest of any airline worldwide, enabling the carrier to enhance operational reliability and fuel efficiency . This modern fleet facilitated the airline's ability to expand its network and meet the evolving demands of the aviation market.
3. Available Seat Miles (ASM)
In 2024, United Airlines achieved a significant milestone by leading the global aviation industry in capacity, recording 311.2 billion Available Seat Miles (ASMs). This figure represents a 6.8% increase from 291.3 billion ASMs in 2023, underscoring United's strategic emphasis on expanding its network to meet growing demand .
The airline's capacity growth was particularly notable in international markets. For instance, in the fourth quarter of 2024, United's ASMs in the Pacific region increased by 6.9% year-over-year, reflecting the airline's focus on high-demand long-haul routes . Similarly, ASMs to Europe rose by 2.3%, indicating a strategic allocation of capacity to regions with strong passenger demand.
Domestically, United maintained robust capacity levels, with a 7.8% year-over-year increase in ASMs during Q4 2024. This growth was facilitated by the optimization of hub operations and fleet utilization, particularly at major hubs like Chicago O'Hare and Denver .
The airline's average stage length in 2024 was 1,490 miles, slightly up from 1,479 miles in 2023, indicating a strategic shift towards longer-haul flights . This adjustment aligns with United's focus on enhancing network efficiency and meeting the evolving preferences of travelers seeking direct, long-distance flights.
United's capacity expansion was supported by its fleet modernization efforts. As of April 2025, the airline operated 1,027 mainline aircraft, the largest fleet among global carriers, enabling it to increase capacity while maintaining operational efficiency .
4. Revenue Passenger Miles (RPM)
United Airlines reported 258.5 billion Revenue Passenger Miles (RPMs) in 2024, marking a 5.8% increase from 244.4 billion RPMs in 2023 . This growth reflects the airline's successful efforts to stimulate demand across its network, particularly in international markets.
In Q4 2024, United's international RPMs totaled 27.96 billion, a 4.2% increase year-over-year, driven by strong performance in the Pacific and Atlantic regions . The Pacific region, in particular, saw an 8.5% boost in PRASM, indicating robust demand for transpacific travel .
Domestically, United's RPMs reached 36.5 billion in Q4 2024, up 7.8% from the same period in 2023 . This increase was supported by the airline's strategic focus on optimizing domestic routes and enhancing connectivity through its hub-and-spoke model.
United's consolidated load factor in 2024 was 83.1%, slightly down from 83.9% in 2023, indicating a marginal decrease in seat utilization . However, the airline's ability to maintain a high load factor amidst capacity expansion demonstrates effective demand management and network planning.
The airline's revenue per available seat mile (RASM) remained strong, with a total of 18.34 cents in 2024, slightly down from 18.44 cents in 2023 . This stability in RASM, despite fluctuations in yield and load factor, underscores United's resilience in revenue generation across varying market conditions.
5. Passenger Load Factor (%) Analysis
In 2024, United Airlines reported a consolidated load factor of 83.1%, a slight decrease from 83.9% in 2023. This marginal decline occurred despite a 6.8% increase in Available Seat Miles (ASMs), indicating that while capacity expanded, demand growth did not fully match the added supply. The average stage length also increased to 1,490 miles, up from 1,479 miles in 2023, suggesting a strategic shift towards longer-haul flights, which may have influenced the load factor dynamics.
International operations played a significant role in shaping the load factor trends. United's expansion into new international markets, including destinations like Nuuk, Greenland, and Ulaanbaatar, Mongolia, contributed to increased ASMs. However, the initial phases of such expansions often involve lower load factors as routes mature and demand stabilizes. Additionally, geopolitical uncertainties and varying regional travel restrictions may have impacted international passenger demand, affecting overall load factor performance.
Domestically, United maintained robust operations, with 1.3 million flights serving over 200 cities in 2024. The introduction of more than 30 new routes enhanced connectivity, yet the domestic load factor faced pressures from intensified competition and fluctuating demand patterns. Economic factors, including consumer confidence and discretionary spending, likely influenced domestic travel behavior, contributing to the observed load factor trends.
6. Financial Performance Analysis
United Airlines achieved a record-breaking financial performance in 2024, with operating revenue reaching $57.1 billion, up 6.2% from the previous year. The airline reported a net income of $3.1 billion, marking a 20.3% increase year-over-year. These results were driven by strategic capacity expansion, diversified revenue streams—including significant contributions from loyalty programs and ancillary services—and effective cost management. The company's strong financial position reflects its resilience and adaptability in a dynamic aviation market.
6.1. Operating Revenue ($) Performance
In 2024, United Airlines' operating revenue reached $57.1 billion, representing a 6.2% increase from $53.7 billion in 2023. This growth was fueled by a 5.7% rise in passenger revenue, totaling $44.3 billion, as the airline transported a record 174 million passengers. The expansion of both domestic and international networks, including the addition of nine new international destinations, played a crucial role in this revenue enhancement.
Cargo operations contributed $2.8 billion to the total revenue, reflecting stable demand for air freight services. Ancillary revenues, encompassing baggage fees, seat selection, and priority boarding, amounted to approximately $4.5 billion, up from $4.1 billion in 2023. This increase underscores United's strategic focus on enhancing customer experience and generating additional revenue streams beyond ticket sales.
Loyalty program revenues also saw significant growth, with a 12% increase year-over-year. United's co-branded credit card partnerships, particularly with JPMorgan Chase, were instrumental in this expansion. The airline introduced new benefits and increased fees for its credit cards and lounge memberships, contributing to the overall revenue growth.
6.2. Net Income ($) Analysis
United Airlines reported a net income of $3.1 billion in 2024, a 20.3% increase from $2.6 billion in 2023. On an adjusted basis, net income stood at $3.5 billion, reflecting the airline's operational efficiency and effective cost management strategies. The adjusted pre-tax margin improved to 8.1%, up from 7.3% the previous year, indicating enhanced profitability.
The airline's earnings per share (EPS) rose to $9.45, with adjusted EPS reaching $10.61. These figures highlight United's ability to generate shareholder value and maintain strong financial health. The company's proactive debt management, including reducing total long-term debt to $24.65 billion, further contributed to its solid financial position.
United's robust net income performance was also supported by its focus on premium offerings and Basic Economy products, which saw revenue increases of 10% and 20%, respectively, in the fourth quarter compared to the previous year. These strategic initiatives enhanced the airline's revenue per available seat mile (RASM) and overall profitability.
The company's strong financial results in 2024 reflect its successful navigation of post-pandemic challenges, strategic investments in network and product enhancements, and commitment to delivering value to shareholders and customers alike.


Comments ()